IT teams have been observing applications for their health and performance since the beginning. They observe the telemetry data (logs, metrics, traces) emitted from the application/microservice using various observability tools and make informed decisions regarding scaling, maintaining, or troubleshooting applications in the production environment.
If observability is not something new and there are a plethora of monitoring and observability tools available in the market,
- why bother about OpenTelemetry (OTel)?
- What makes it special such that OTel is getting widely adopted?
- And most importantly, what is in it for developers, DevOps, and SRE folks?
Well, let us find out.
What is OpenTelemetry (OTel)?
OpenTelemetry (OTel) provides open-source standards and formats for collecting and exporting telemetry data from microservices for observability purposes.
The standardized way of collecting data helps DevOps and SRE engineers use any compatible observability backend of their choice to observe services and infrastructure, without being vendor locked-in.
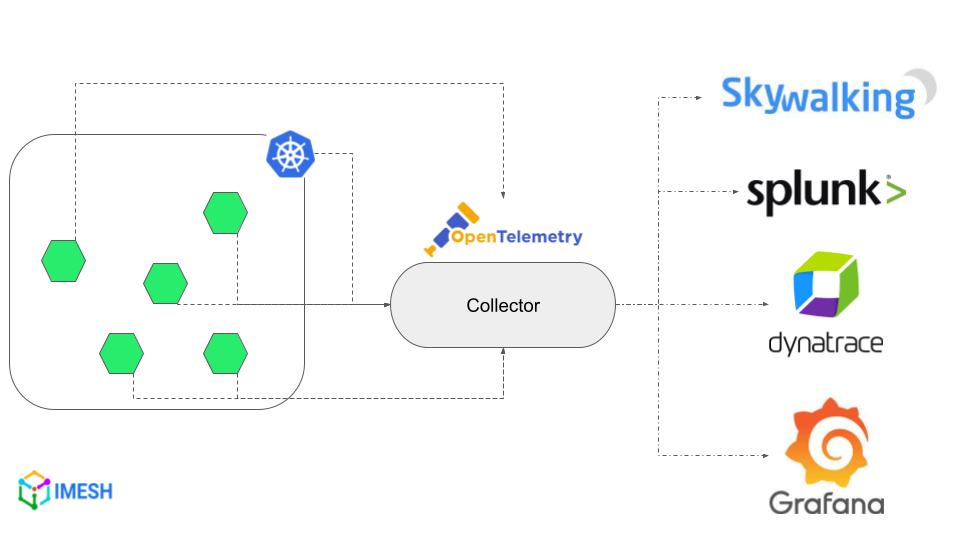
OpenTelemetry diagram for microservices deployed in a Kubernetes cluster
OpenTelemetry is both a set of standards and an open-source project that provides components, such as collectors and agents, for its implementation. Besides, OTel offers APIs, SDKs, and data specifications for application developers to standardize instrumenting their application code.
(Instrumentation is the process of adding observability libraries/dependencies to the application code so that it emits logs, traces, and metrics.)
Why is OpenTelemetry good news for DevOps and SREs
The whole observability process starts with application developers. Typically, they instrument application code with the proprietary library/agent provided by the observability backend tool that IT teams plan to go with.
For example, let us say IT teams want to use Dynatrace as the observability tool. Then, application developers use code/SDKs from Dynatrace to instrument (i.e., to generate and export telemetry data) all the applications in the system. It helps to fetch and feed data in the format Dynatrace is compatible with. But this is where the problem lies.
The observability requirements of DevOps and SREs seldom stay the same. They will have to switch between vendors providing observability tools or may want to use more than one tool, as their needs evolve.
But, since all the applications are instrumented with the proprietary code from the current vendor, switching becomes a nightmare:
- The new vendor may prefer collecting telemetry data in a format (tracing format, for example) not compatible with the existing vendor.
- It means developers will have to rewrite the instrumentation code for all applications. This will have severe overhead in terms of cost, developer effort, and potential service disruptions, depending on the deployments and infrastructure.
- Non-compatible formats also cause problems with historical data while switching vendors. That is, it becomes hard for DevOps and SREs to analyze the performance before and after the migration.
This is where OpenTelemetry proves helpful and the reason it is being widely adopted.
OTel prevents such vendor lock-in by standardizing telemetry data collection and exportation. With OpenTelemetry, developers can send the data to one or more observability backends, be it open-source or proprietary, as it supports most of the leading observability tools.
OpenTelemetry architecture
OpenTelemetry provides certain vendor-agnostic components that work together to fetch, process, and export telemetry data to various backends. There are three major components: Instrumentation library, OTel Collector, and Exporters.
Instrumentation library
OpenTelemetry provides SDKs and libraries for application developers to instrument their code manually or automatically. They support many popular programming languages, such as Java, Python, Ruby, Rust, JavaScript, and more.
The instrumentation library is evolving, and developers should check the status of the telemetry data component in the instrumentation library, specific to the programming language they use. OpenTelemetry docs update them frequently. The status at the time of writing this piece is given below:

Status of programming language-specific telemetry data support in OpenTelemetry
For Kubernetes workloads, OpenTelemetry Operator for Kubernetes can be used to inject auto-instrumentation libraries.
OpenTelemetry Collector (OTC)
The collector has receiver, processor, and exporter components, which gather, process, and export telemetry data from instrumented applications or infrastructure to observability backends for visualization (refer to the image below). It can receive and export data in various formats, such as its native format (OpenTelemetry Protocol or OTLP), Prometheus, Jaeger, and more.
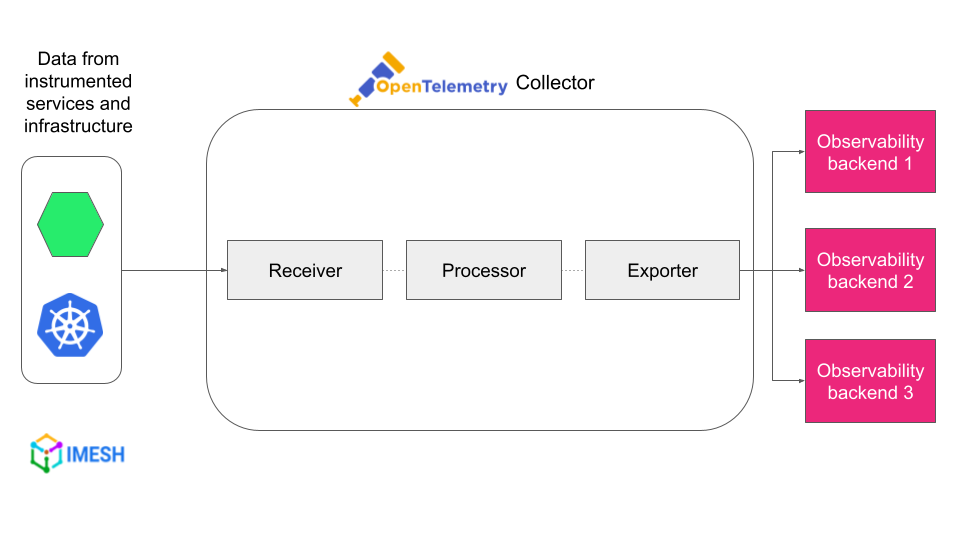
OpenTelemetry Collector components and workflow
OTC can be deployed as an agent — either as a sidecar container that runs alongside the application container or as a DaemonSet that runs on each node. And it can be scaled in or out depending on the data throughput.
OpenTelemetry Collector is not mandatory since OpenTelemetry is designed to be modular and flexible. IT teams can pick components of their choice as receivers, processors, and exporters or even add custom ones.
OpenTelemetry Exporters
They allow developers to configure any compatible backend they want to send the processed telemetry data to. There are open-source and vendor-specific exporters available. Some of them are Apache Skywalking, Prometheus, Datadog, and Dynatrace, which are part of the contrib projects. You can see the complete list of vendors who provide exporters here.
The difference between trace data collected by OTel and Istio
In a distributed system, tracing is the process of monitoring and recording the lifecycle of a request as it goes through different services in the system. It helps DevOps and SREs visualize the interaction between services and troubleshoot issues, like latency.
Istio is one of the most popular service mesh software that provides distributed tracing for observability purposes. In Istio, application containers accompany sidecar containers, i.e., Envoy proxies. The proxy intercepts traffic between services and provides telemetry data for observability (refer to the image below).
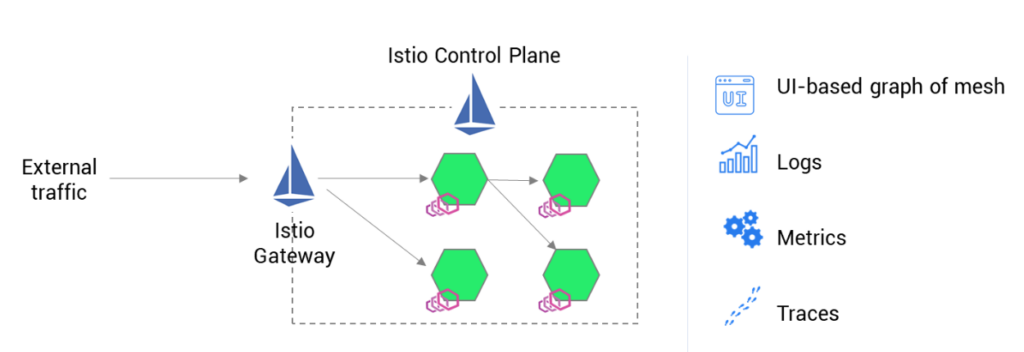
Istio sidecar architecture and observability
Although both OpenTelemetry and Istio provide tracing data, there is a slight difference between them.
Istio focuses on the lifecycle of a request as it traverses through multiple services in the system (networking layer) while OpenTelemetry — given that the application is instrumented with the OpenTelemetry library — focuses on the lifecycle of a request as it flows through an application (application layer), interacting with various functions and modules.
For example, let us say service A is talking to service B, and the communication has latency issues. Istio can show you which service causes latency and by how much. While this information is enough for DevOps and SREs, it will not help developers debug the part of the application that is causing the problem.
This is where OpenTelemetry tracing helps. Since the application is instrumented with the OTel library, OpenTelemetry tracing can provide details regarding the specific function of the application that causes latency here.
To put it another way, Istio gives traces from outside the application, while OpenTelemetry tracing provides traces from within the application. Istio tracing is good for troubleshooting problems at the networking layer, while OpenTelemetry tracing helps to troubleshoot problems at the application level.
OpenTelemetry for microservices observability and vendor neutrality
Enterprises adopting microservices architecture have applications distributed across the cloud, with respective IT teams maintaining them. By instrumenting applications with OpenTelemetry libraries and SDKs, the IT teams are free to choose any compatible observability backend of their choice.
The choice will not affect the Ops/SRE teams’ ability to have central visibility into the entire services in the system. OTel supports a variety of data formats and seamlessly integrates with most of the open-source and vendor-specific monitoring and observability tools. This also makes switching between vendors painless.
Get started with OpenTelemetry for Istio service mesh
Watch the following video to learn how to get started with OpenTelemetry for Istio service mesh to achieve observability-in-depth:
Additionally, you can go through the blog, Integrate Istio and Apache Skywalking for Kubernetes Observability, where OTel collector is used to scrape Prometheus endpoints.