In enterprises, SREs, DevOps and cloud architects often discuss which platform to choose for observability for faster troubleshooting of issues and understanding about performance of their production systems. There are certain questions they need to answer to get maximum value for their team such as:
- Will an observability tool support all kinds of workloads and heterogeneous systems?
- Will the tool support all kinds of data aggregation such as logs, metrics, traces, topology etc..?
- Will the investment in the (on-going or new) observability tool justified?
In this article, we will provide the best way to get started with unified observability of your entire infrastructure using open source Skywalking and Istio service mesh.
Istio Service mesh of multicloud application
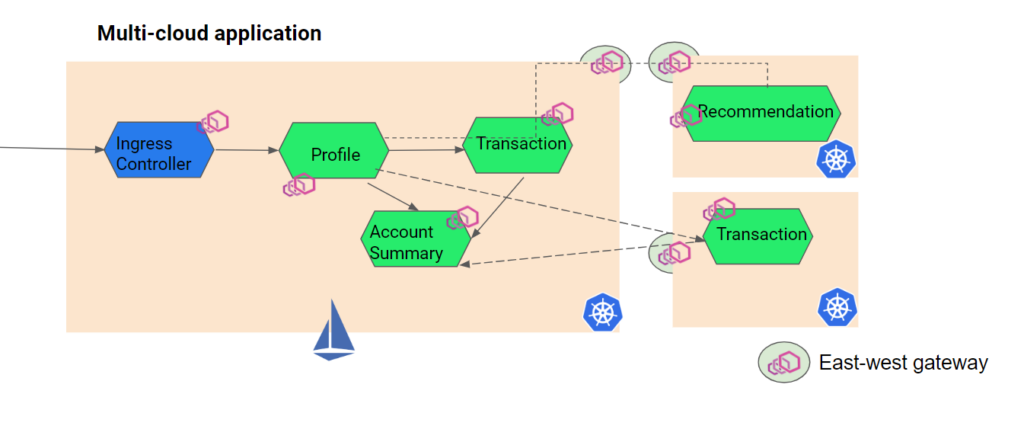
Let us take an example of a multicloud example where there are multiple services hosted on on-prem or managed Kubernetes clusters. The first step for unified observability will be to form a service mesh using Istio service mesh. The idea is that all the services or workloads in Kubernetes clusters (or VMs) should be accompanied with an Envoy proxy to abstract the security and networking out of business logic. As you can see in the below image a service mesh is formed and the network communication between edge to workloads, among workloads, and between clusters are controlled by the Istio control plane.
In this case Istio service mesh emits a logs, metrics, traces for each Envoy proxies which will help to get unified observability. We need a visualization tool like Skywalking to collect the data and populate for granular observability.
Why Skywalking for Observability
SREs from large companies such as Alibaba, Lenovo, ABInBev, Baidu use Apache Skywalking and the common reasons are:
- Skywalking aggregates logs, metrics, traces and topology.
- It natively supports popular service mesh software like Istio. While other tools may not support getting data from Envoy sidecars, Skywalking supports sidecar integration.
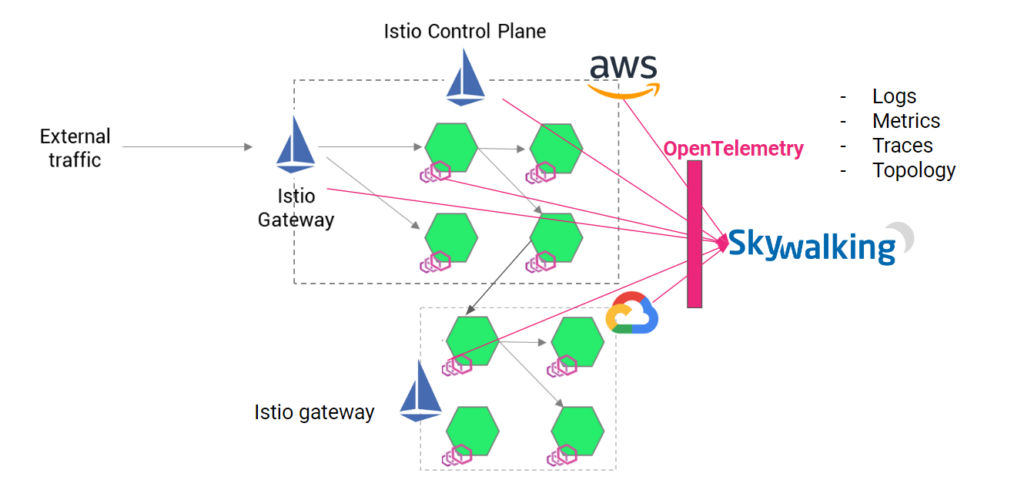
- It supports OpenTelemetry (OTel) standards for observability. These days OTel standards and instrumentation are popular for MTL (metrics, logs, traces).
- Skywalking supports observability-data collection from almost all the elements of full stack- database, OS, network, storage and other infrastructure.
- It is open source and free (with an affordable enterprise version).
Now let us see how to integrate Istio and Apache skywalking in your enterprise.
Steps to integrate Istio and Apache Skywalking
We have created a demo to establish the connection between the Istio data plane and Skywalking, where it will collect data from Envoy sidecars and populate them in the observability dashboards.
Note: By default, Skywalking comes with predefined dashboards for Apache APISIX and AWS Gateways. Since we are using Istio Gateway, it will not get a dedicated dashboard out-of-the-box, but we’ll get metrics for it in other locations.
If you want to watch the video, check out my latest Istio-Skywalking configuration video.
You can refer to the Github link here.
Step:1- Add kube-state-metrics to collect metrics from Kubernetes API server
We have installed kube-state-metrics service to listen to the kubernetes API server and send those metrics to Apache skywalking.
First add the prometheus community repo:
helm repo add prometheus-community
https://prometheus-community.github.io/helm-charts
(After every “helm repo add”, add a line about running “helm repo update” to fetch the latest charts.)
And now you can install kube-state-metrics.
helm install kube-state-metrics prometheus-community/kube-state-metricsStep:2- Install Skywalking using HELM charts
We will install Skywalking version 9.2.0 for this observability demo.
You can run the following command to install Skywalking into a namespace ( my namespace is ‘skywalking’). You can refer to the values.yaml.
helm install skywalking oci://registry-1.docker.io.apache/skywalking-helm -f -n skywalking(Optional reading) In helm chart values.yaml, you will notice that:
- we have made the flag oap (observability analysis platform, i.e. the back-end) and ui configuration as true.
- Similarly for databases, we have enabled postgresql as true.
- For tracking metrics from Envoy access logs, we have configured the following environmental variables:
- SW_ENVOY_METRIC: default
- SW_ENVOY_METRIC_SERVICE: true
- SW_ENVOY_METRIC_ALS_HTTP_ANALYSIS: k8s-mesh,mx-mesh,persistence
- SW_ENVOY_METRIC_ALS_TCP_ANALYSIS: k8s-mesh,mx-mesh,persistence
This is to select the logs and metrics from the Envoy from Istio configuration (‘c’ and ‘d’ are the rules for analyzing Envoy access logs).
- We will enable the OpenTelemetry receiver, and configure it to receive data in otlp format. We will also enable OTel rules according to the data we will send to Skywalking. In a few moments (in Step 3), we will configure the OTel collector to scrape istiod, k8s, kube-state-metrics, and the Skywalking OAP itself. So we have enabled the appropriate rules:
- SW_OTEL_RECEIVER: default
- SW_OTEL_RECEIVER_ENABLED_HANDLERS: “otlp”
- SW_OTEL_RECEIVER_ENABLED_OTEL_RULES: “istio-controlplane,k8s-cluster,k8s-node,k8s-service,oap”
- SW_TELEMETRY: prometheus
- SW_TELEMETRY_PROMETHEUS_HOST: 0.0.0.0
- SW_TELEMETRY_PROMETHEUS_PORT: 1234
- SW_TELEMETRY_PROMETHEUS_SSL_ENABLED: false
- SW_TELEMETRY_PROMETHEUS_SSL_KEY_PATH: “”
- SW_TELEMETRY_PROMETHEUS_SSL_CERT_CHAIN_PATH: “”
We have instructed Skywalking to collect data from Istio control plance, Kubernetes cluster, node, services and also oap (Observability Analytics Platform by Skywalking).
(The configurations from ‘d’ to ‘i’ enable Skywalking OAP’s self-observability, meaning it will expose Prometheus-compatible metrics at port 1234 with SSL disabled. Again in Step 3, we will configure the OTel collector to scrape this endpoint.)
In the helm chart, we have also enabled the creation of a service account for Skywalking OAP.
Step:3- Setting up Istio + Skywalking Configuration
After that we can install Istio using this IstioOperator configuration. In the IstioOperator configuration, we have set up the meshConfig so that every Sidecar will have enabled the envoy access logs service, and set the address for access logs service and metrics service to skywalking. Additionally with the proxyStatsMatcher, we are configuring all metrics to be sent via the metrics service
meshConfig:
  defaultConfig:
    envoyAccessLogService:
      address: "skywalking-skywalking-helm-oap.skywalking.svc:11800"
    envoyMetricsService:
    	address: "skywalking-skywalking-helm-oap.skywalking.svc:11800"
    proxyStatsMatcher:
    	inclusionRegexps:
        - .*
  enableEnvoyAccessLogService: true
Step:4- OpenTelemetry Collector
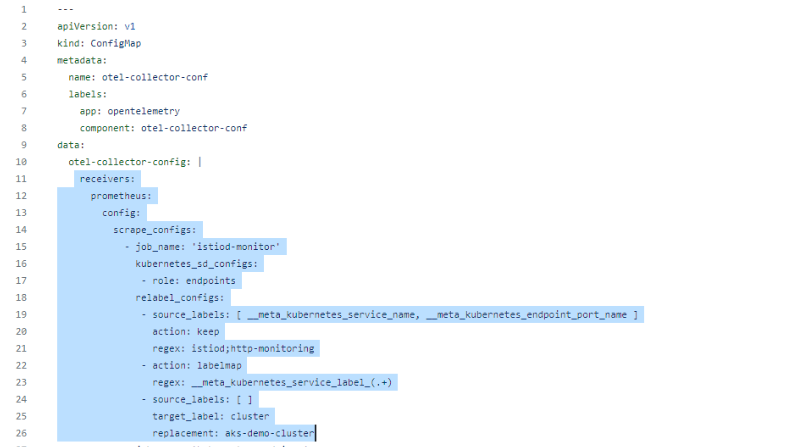
Once the Istio and Skywalking configuration is done, we need to feed metrics from applications, gateways, nodes, etc to Skywalking. We have used the opentelemetry-collector.yaml to scrape the Prometheus compatible end-points. In the collector we have mentioned that OpenTelemetry will scrape metrics from istiod, Kubernetes-cluster, kube-state-metrics and skywalking.
We have created a service account for OpenTelemetry. Using opentelemetry-serviceaccount.yaml, we have set up a service account, declared ClusterRole and ClusterRoleBinding to define what all actions the opentelemetry service account will be able to take on various resources in our Kubernetes cluster.
Once you deploy the opentelemetry-collector.yaml and opentelemetry-serviceaccount.yaml, there will be data flowing into Skywalking from- Envoy, Kubernetes cluster, kube-state-metrics and Skywalking (oap).
Step:5- Observability of Kubernetes resources and Istio resource in Skywalking
To check the UI of Skywalking, port-forward the Skywalking UI service to port (say 8080). Run the following command:
kubectl port-forward svc/skywalking-skywalking-helm-ui -n skywalking 8080:80You can open the Skywalking UI service at localhost:8080.
( Note: For setting up load to services and see the behavior and performance of apps, cluster and Envoy proxy check out the full video. )
Once you are on the Skywalking UI (refer the image below), you can select service mesh in the left-side menu,and select control plane or data plane.
Skywalking would provide all the resource consumption and observability data of Istio control and data plane respectively.
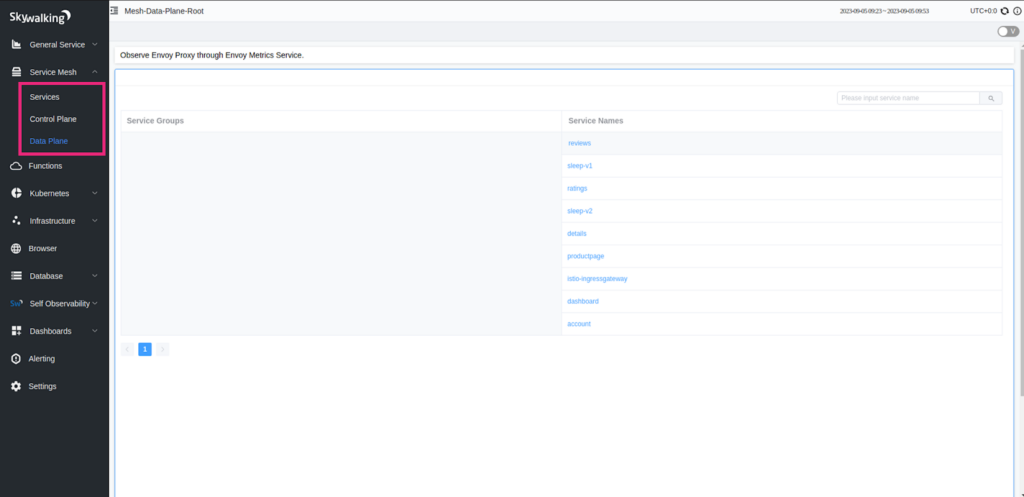
Fig: Skywalking Istio-dataplane provides info about all the Envoy proxies attached to services
Skywalking provides metrics, logs, and traces of all the Envoy proxies. Refer the below image where all the observability details are displayed for just one service-proxy.
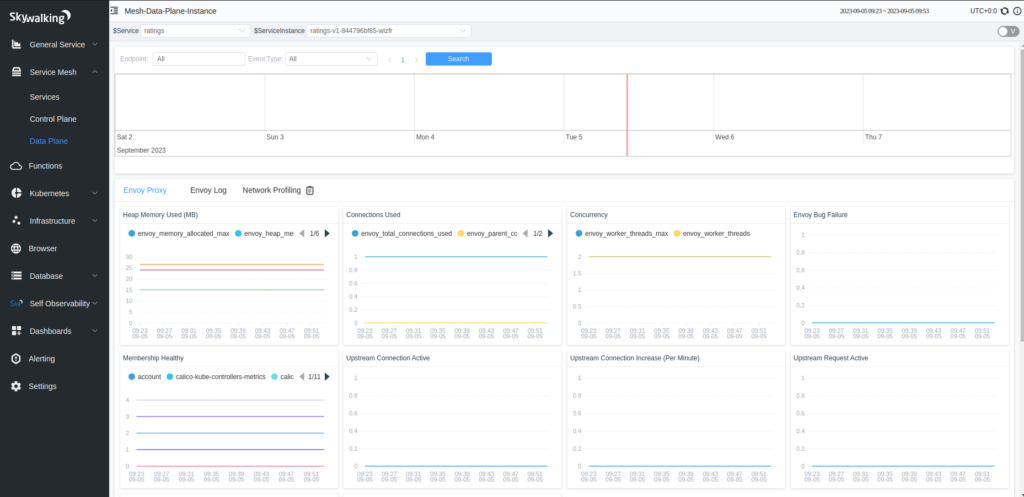
Fig: Skywalking provides the resource consumption of Envoy proxies in various namespaces
Similarly, Skywalking also provides all the observable data of the Istio control plane. Note, in case you have multiple control planes in different namespaces ( in multiple clusters) you just provide the access Skywalking oap service.
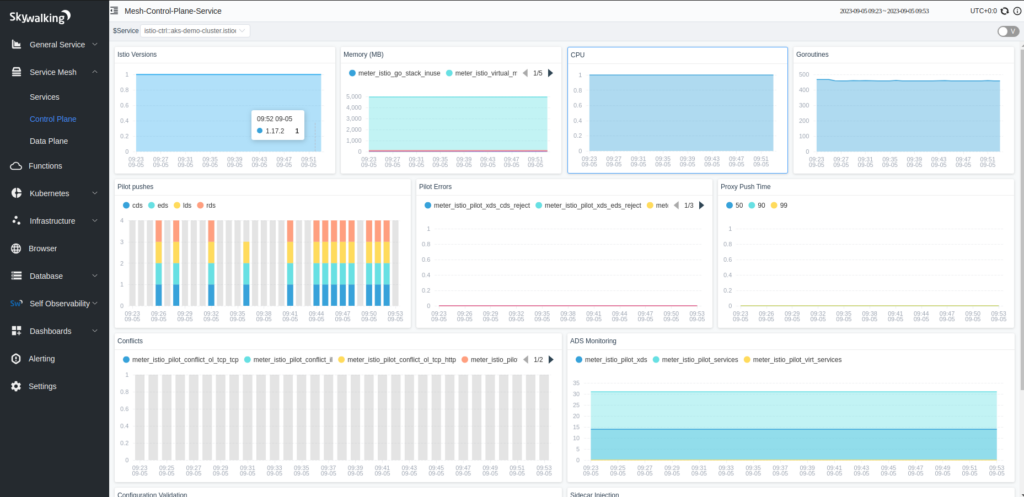
Fig: Skywalking provides Istio control planes like metrics, number of pilot pushes, ADS monitoring etc.
Apart from the Istio service mesh, we also configured Skywalking to fetch information about the Kubernetes cluster. You can see in the below image, Skywalking provides all the info about Kubernetes dashboard such as number of nodes, pods, K8s deployments, services, pods, and containers, etc. You also get the respective resource utilization metrics of each K8s resource in the same dashboard.
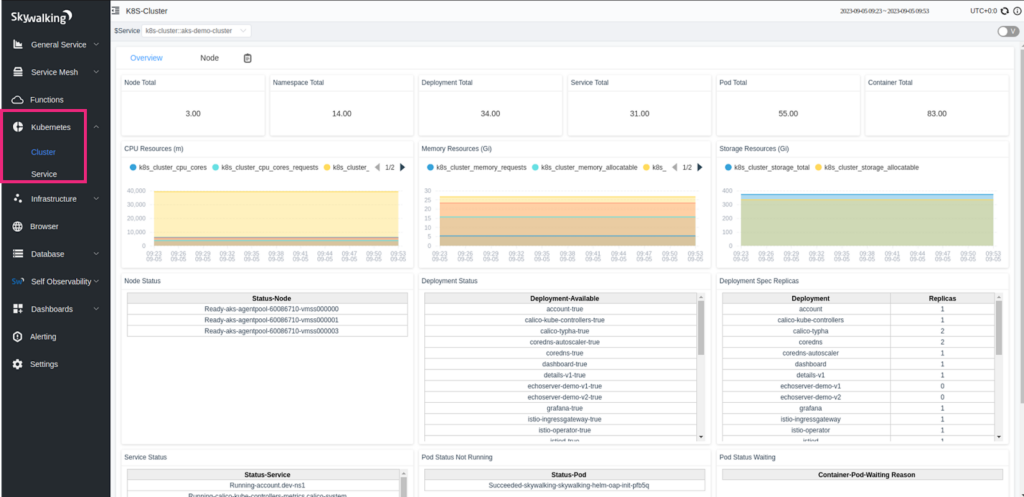
Fig: Skywalking provides holistic information about a Kubernetes cluster
Similarly, you can drill further down into a service in the Kubernetes cluster and get granular information about their behavior and performance. (refer the below images)
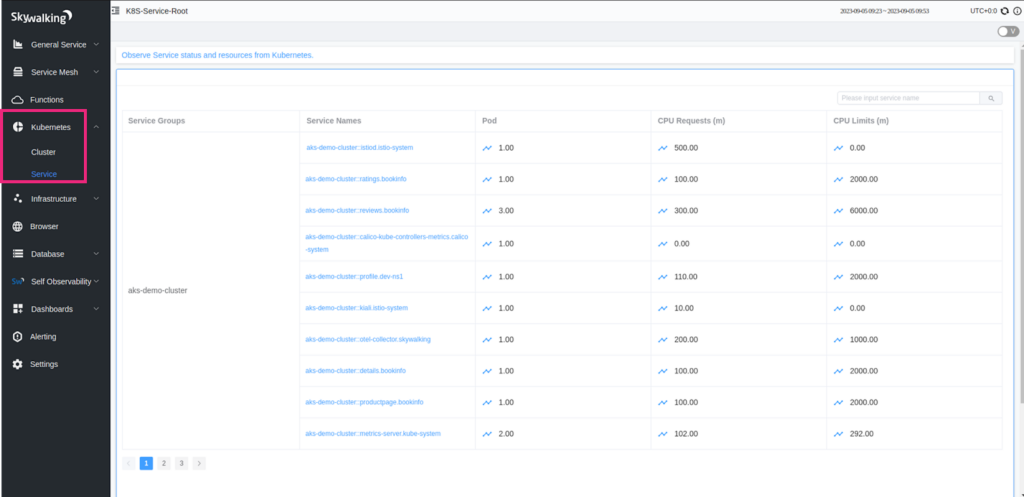
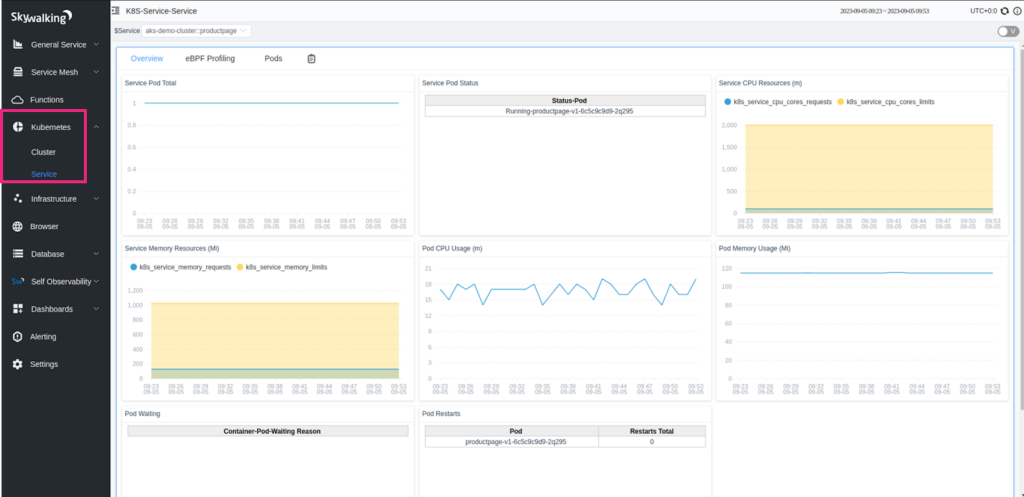
For setting up load to services and see the behavior and performance of apps, cluster and Envoy proxy check out the full video.
Benefits of Istio Skywalking integrations
There are several benefits of integrating Istio and Apache Skywalking for Unified observability.
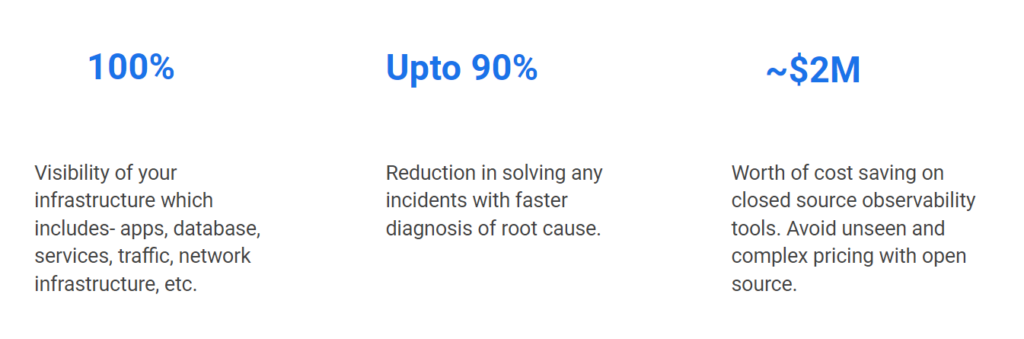
- Ensure 100% visibility of technology stack including apps, sidecars, network, database, OS, etc.
- Reduce 90% of the time to find the root cause (MTTR) of issues or anomalies in production with faster troubleshooting.
- Save approximately ~$2M of lifetime spend on closed-source solutions, complex pricing and custom integrations