In the previous release 1.0 of IMESH API Gateway, we introduced new features for developers and DevOps folks to create and manage Routes using a UI in the Kubernetes clusters. At the start, we were still determining whether engineers would appreciate the UI-based method of creating API resources. But the moment they understood our platform creates YAML files in the backend and supports GitOps-based deployment, many engineers liked it. Our mission is to help developers adopt Kubernetes Gateway API and advanced network management solutions for their applications without a context switch.
After discussing this with a few prospects, we realized that creating and managing resources and visualizing API resources’ performances are equally important.
In this release 2.0, or Virgo (name of another constellation), we have introduced visualization of network performance at the edge or API resources.
The single-pane-of-glass provides a centralized, enterprise-wide visibility into various dimensions of APIs in an organization. The two main features in the API dashboard are:
- API Dashboard: To visualize gateways, traffic health, trends, and endpoint performance.
- Errors: To visualize error trends in the traffic, 4XX and 5XX errors mix, and endpoint error rate.
API Dashboard for enhanced visibility of Gateway and Route performance
DevOps and cloud teams can click on the API Dashboard under the Visibility menu. At the top, there will be two drop-down menus: Cluster and Gateway. To see the network’s performance, one must select their cluster and Gateway values from the drop-down values.
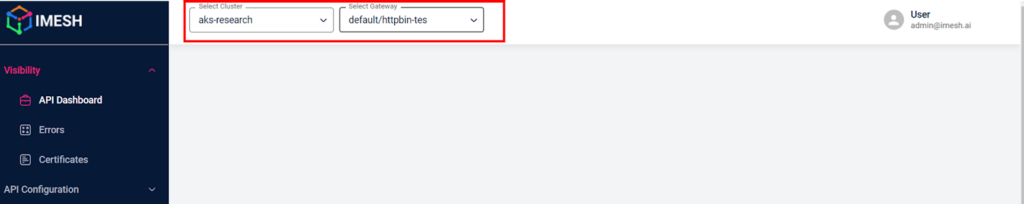
Fig A: Gateway and Cluster selection for the API Dashboard
After the selection of the value, you will find the following essential sections:
- Gateway Overview
- Health Overview
- Traffic Trend
- HTTP Response codes
- Popular endpoints
Gateway Overview
Gateway Overview provides general information about a Gateway and how much it is getting used. In the Gateway Overview section (refer to Fig B), you can find the following info:
- Configuration Address: (if any) Custom address configured for the Gateway
- Bound Listeners: The number of listeners configured in different ports. For example, in the image, there are two listeners configured for HTTP and TCP traffic in ports 80 and 443, respectively.
- Attached Routes: Specifies the number of Routes attached to listeners of the Gateway.
- Avg CPU Utilization: Highlights the average CPU utilized in a given period.
- Avg Memory Utilization: Highlights the average memory utilization in a given period.
Note: The period for Gateway Overview can be selected as 24 hours or 1 hour from the right-hand side toggle.
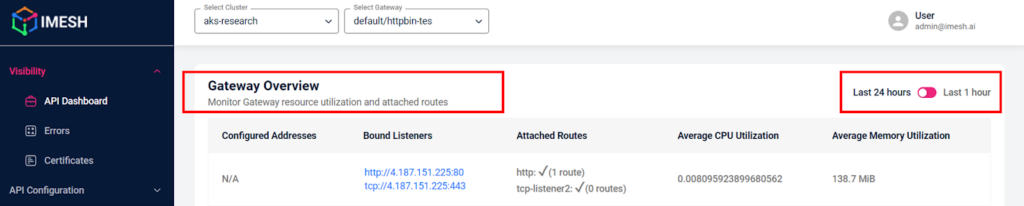
Fig B: Gateway Overview
Health Overview
In this section, the user will get the traffic details (refer Fig C) in the last 1 hour. Details are as follows:
- HTTP Connection details: Highlights the number of inbound connections successfully established and failed with the Gateway. Inbound connections are a handshake from Clients to the Gateway.
- HTTP Requests: This provides an idea of the total requests made through the established connections and the overall error rate of the communication.
- Data Transfer: This highlights the transfer in both Outbound and Inbound request handling.
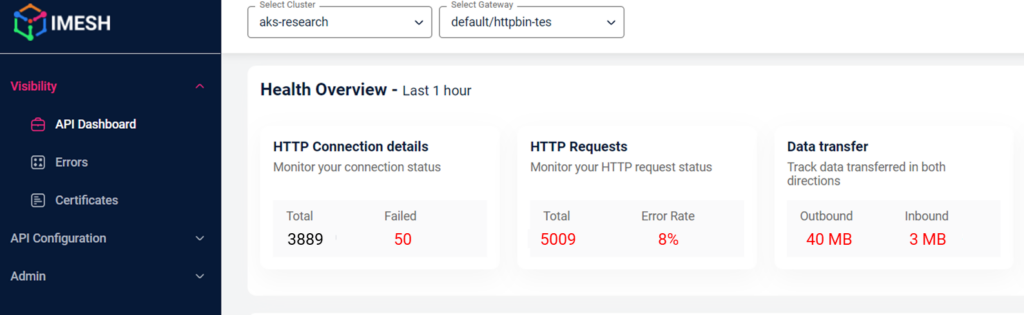
Fig C: HTTP Connection and Request Overview in IMESH API Gateway
Traffic Trend
The Traffic Trend section highlights the trend and behavior of a Gateway in the last 24 hours and 7 days. The trend graph, which provides the number of successful requests and the error rate, will help the DevOps team identify anomalies (instances when error rates are high). After careful observation of the trend, SRE teams can provide a threshold for error rates and take proactive actions to minimize them.
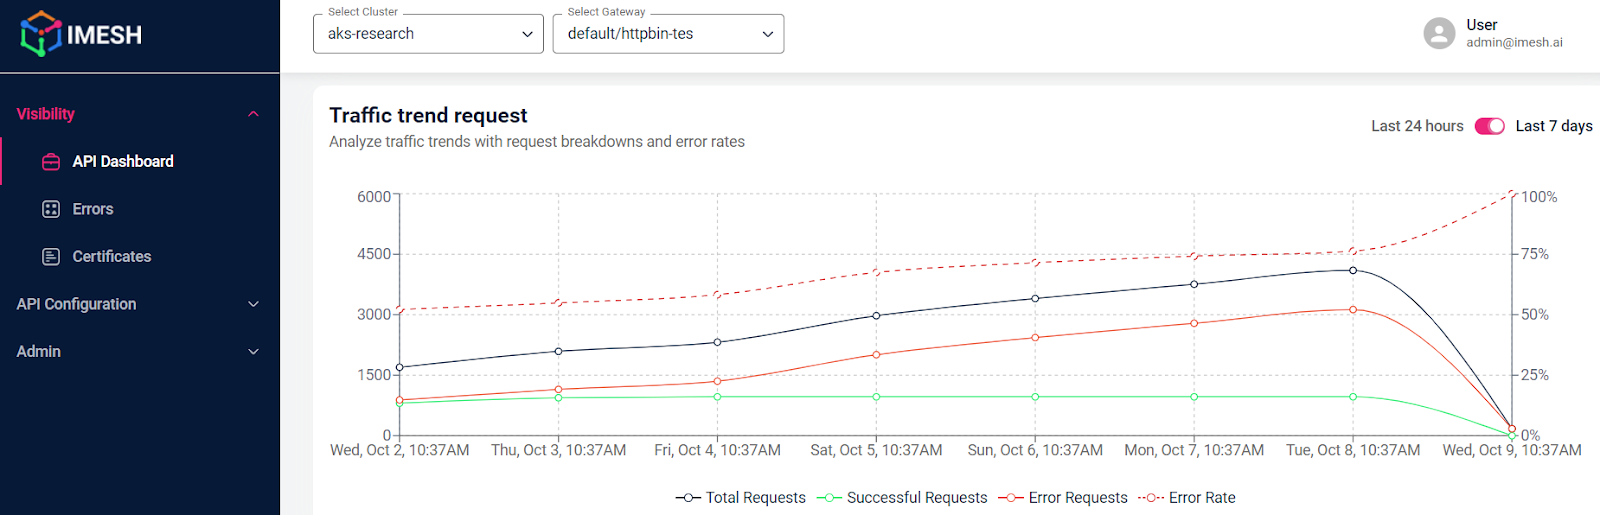
Fig D: Traffic trends showcasing requests served, failed requests, and error rate
HTTP Response codes
This section provides the mix of response codes (refer to Fig E)) in a Gateway in the last hour and 24 hours. The data compares the number of error codes (4XX and 5XX) and successful requests (2XX and 3XX).
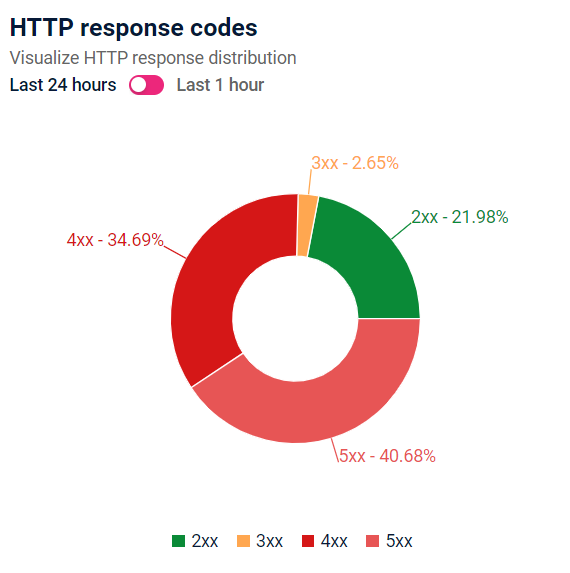
Fig E: Piechart highlighting the mix of HTTP Response codes
Popular endpoints
The popular endpoints section provides information about popular Routes and paths clients call through the Gateway. It offers the total number of requests hit to a particular endpoint, the number of failed requests (error requests), and the average latency of each route.
This data is helpful for DevOps and SREs in pinpointing the critical application that is getting more requests in a given time or more failed requests. Accordingly, they can provide feedback to developers and co-jointly develop solutions to increase the reliability of their overall systems. For example, they can check for configuration-related issues regarding Envoy proxy or Istio, or else the application itself would need to be optimized.
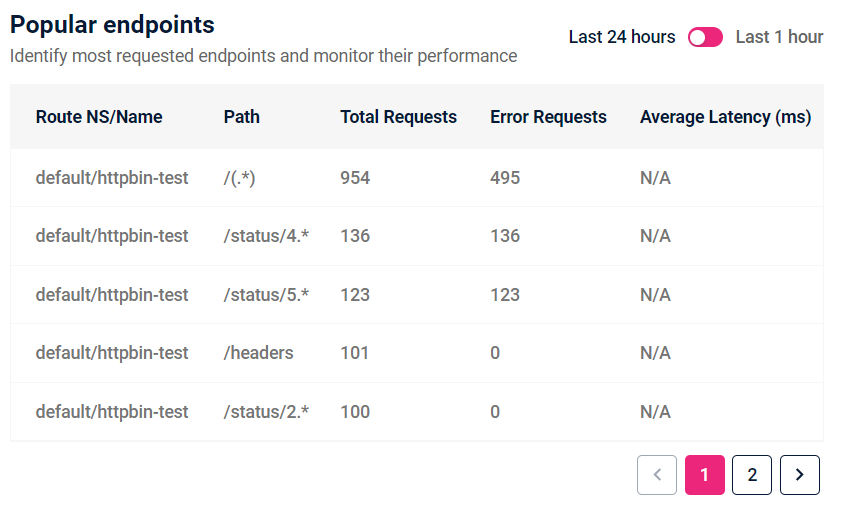
Fig F: Popular endpoints and path based on the highest number of requests served
Errors dashboard for proactive fixing of network issues
Users can click on the Error dashboard under the Visibility menu. The IMESH API Gateway Error dashboard provides DevOps with holistic information about errors occurring at the Gateway level. The information are as follows
- Error Trends
- 4XX and 5XX error mix
- Error rate for all endpoints
Error Trends
Under this section, users will find the graph highlighting the 4XX and 5XX error trends. The graph provides a filter to select the kind of 4XX and 5XX errors. For example, if an SRE wants to see the trend of 400 Bad requests, he can choose 400 from the filter, and the graph would showcase the trend for 400 in the last 24 hours and 7 days, respectively.
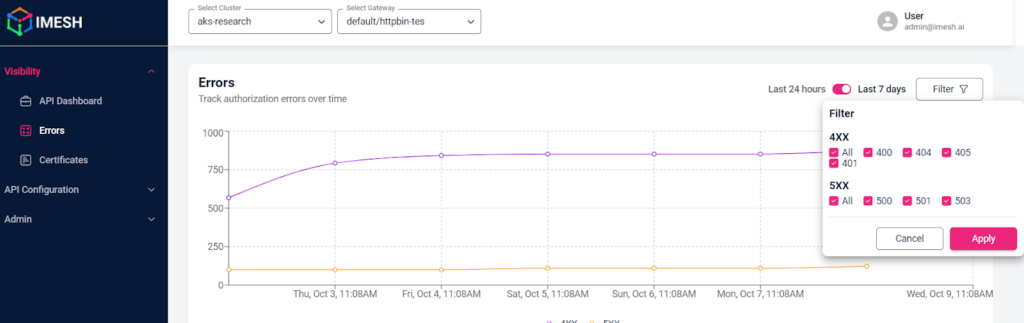
Fig G: Error trend graph for 4XX and 5XX codes in IMESH API Gateway
4XX and 5XX Error Mix
In this section, users will know about the 4XX error mix and 5XX error mix. For example, the left pie charts (in Fig H) will provide an idea of the number of 400, 401, 402, 403, and other 4XX errors in the last 1 hour. This information will help SREs or DevOps become more contextual about error codes in the traffic.
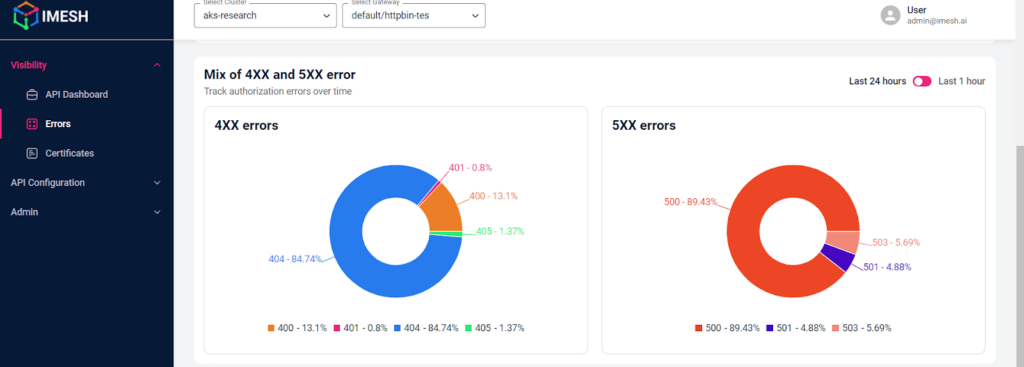
Fig H: Piecharts for 4XX and 5XX error codes, respectively
Error rate for all endpoints
The following logical information SRE or DevOps would require is the Route where these errors occur. In this section, IMESH API Gateway provides a table of Routes in decreasing order of error occurring. In the image below, Routes are sorted with more 4XX errors occurring. This will bring their attention to the Network Routes, which must be fixed immediately.
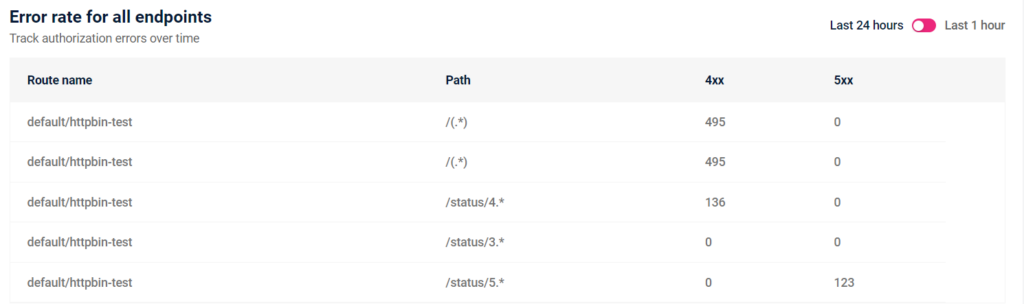
Fig I: Popular endpoints ordered wrt highest error number of error codes (4XX)
Benefits of API Dashboard and Error Dashboard
The dashboard was built after taking feedback from leaders in modern enterprises’ DevOps and Cloud teams. The API and Error dashboards will bring immense value to ensuring an organization’s healthy, reliable, and resilient network.
The following are the three key benefits:
- Proactively Monitoring traffic at the edge: With information on the performance and behavior of APIs—gateways and Routes—the cloud and SRE team can take proactive actions to check their gateway configurations, resource consumption, or application optimization in a timely manner.
- Increased collaboration and faster MTTR: IMESH API Gateway provides information on popular endpoints and their error mix on routes, which can be critical for tracking performance and diagnosing issues. The DevOps team can better collaborate with application developers and co-jointly develop and create network policies for better and faster request processing.
- Improve network reliability: IMESH API Gateway is designed to improve the reliability and resiliency of networks in Kubernetes. DevOps can use policies based on historical trends of eros and Gateway performances to enhance the network’s stability and health.
- User behavior insights: With detailed insights into popular endpoints and API consumption patterns, product managers and application owners can make data-driven decisions about API improvements and product strategies.
- Versioning and Deprecation: For an organization that monetizes its APIs, the Visualization dashboards help with versioning, offering clear visibility into available API versions and deprecation timelines