
Intro to Istio observability using Prometheus
Istio service mesh abstracts the network from the application layers using side-car proxies. You can implement security and advance networking policies to all the communication across your infrastructure using Istio.
But another important feature of Istio is observability. You can use Istio to observe the performance and behavior of all your microservices in your infrastructure. One of the primary responsibilities of Site reliability engineers (SREs) in large organizations is to monitor the golden metrics of their applications, such as CPU utilization, memory utilization, latency, and throughput.
In this article, we will discuss how SREs can benefit from integrating three open-source software- Istio, Prometheus, and Grafana. While Istio is the most famous service software, Prometheus is the most widely used monitoring software, and Grafana is the most famous visualization tool.
Note: The steps are tested for Istio 1.17.X
Watch the video of Istio, Prometheus and Grafana configuration
Watch the video if you want to follow the steps from video,
Step-1: Go to Istio addons and apply Prometheus and Grafana yaml file
First go to the addon folder in Istio directory using the command. Since I am using 1.17.1, the path for me is istio-1.17.1/samples/addons
You will notice that Istio already provides a few yaml files to configure Grafana, Prometheus, Jaeger, Kiali, etc. You can configure Prometheus by using the following command:
kubectl apply -f prometheus.yamlkubectl apply -f grafana.yaml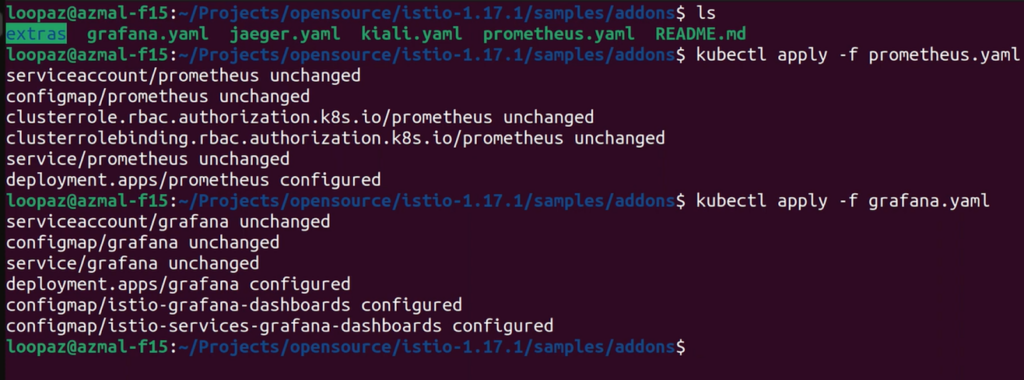
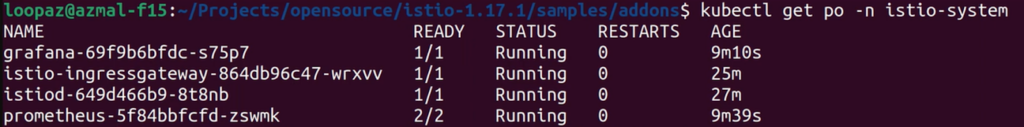
Note these addon yaml are applied to istio-system namespace by default.
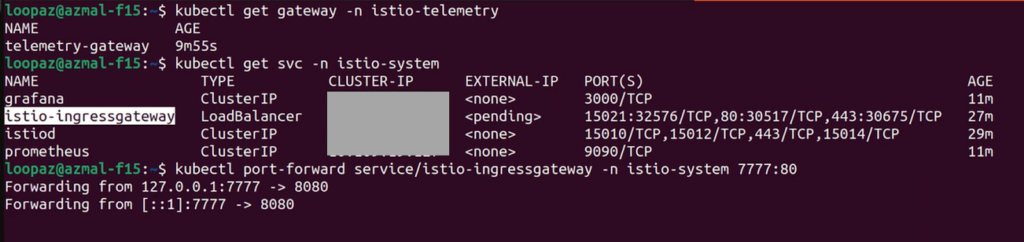
Step-2: Deploy new service and port-forward Istio ingress gateway
To experiment with the working model, we will deploy the httpbin service to an istio-enabled namespace. And we will create an object of Istio ingress gateway to receive the traffic to the service from the public.
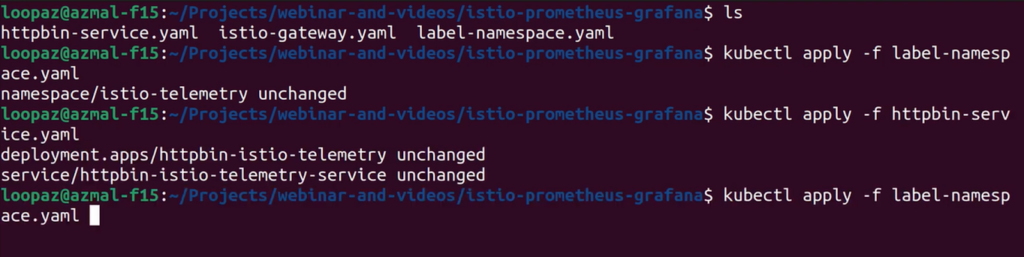
We will also port-forward the Istio ingress gateway to a particular port-7777.
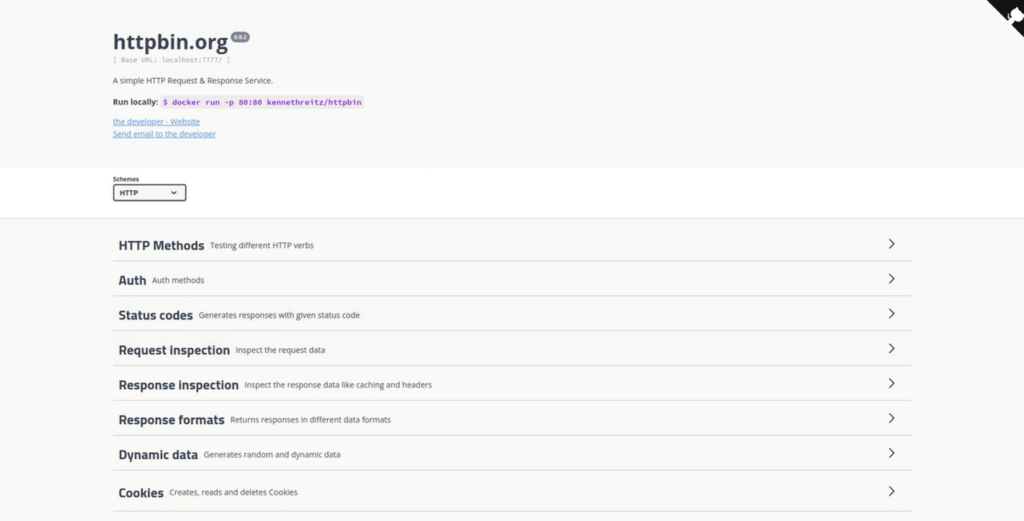
You should see the below screen at localhost:7777
Step-3: Open Prometheus and Grafana dashboard
You can open the Prometheus dashboard by using the following command.
istioctl dashboard prometheus istioctl dashboard grafanaBoth the Grafana and Prometheus will open in the localhost.

Step-4: Make HTTP requests from Postman
We will see how the httpbin service is consuming CPU or memory when there is traffic load. We will create a few GET and POST requests to the localhost:7777 from the Postman app.

Once you GET or POST requests to httpbin service multiple times, there will be utilization of resources and we can see them in Grafana. But at first we need to configure the metrics for httpbin service in Prometheus and Grafana.
Step-5: Configuring metrics in Prometheus
One can select a range of metrics related for any Kubernetes resources such as API server, applications, workloads, envoy, etc. We will select container_memory_working_set_bytes metrics for our configuration.
In the Prometheus application, we will select the namespace to scrape the metrics using the following search term: container_memory_working_set_bytes { namespace= “istio-telemetry”} (istio-telemetry is the name of our Istio enabled namespace where httpbin service is deployed)
Note that, simply running this we get the memory for our namespace, since we want to analyze the memory usage of our pods, we can calculate the total memory consumed by summing the memory usage of each pod grouped by pod. The following query will help us in getting the desired result : sum(container_memory_working_set_bytes{namespace=”istio-telemetry”}) by (pod)

Note: Prometheus provides a lot of flexibility to filter, slice and dice the metric data. The central idea of this article was to showcase the ability of Istio to emit and send metrics to Prometheus for collection
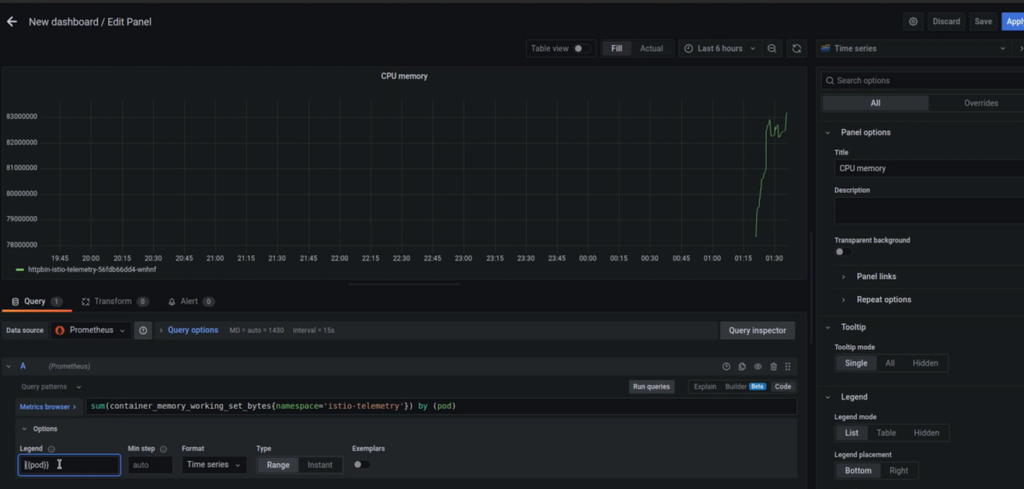
Step-:6 Configuring Istio metrics graphs in Grafana
Now you can simply take the query sum(container_memory_working_set_bytes{namespace=”istio-telemetry”}) by (pod) in Prometheus and plot a graph with time. All you need to do is create a new dashboard in Grafana and paste the query in the metrics browser. Grafana will plot a time-series graph. You can edit the graph with proper name, legends and titles for sharing with other stakeholders in the Ops team. .
There are several ways to tweak and customize the data and depict the Prometheus metrics in Grafana. You can choose to make all the customization based on your enterprise needs. I have done a few experiments in the video; feel free to check it out.
Conclusion
Istio service mesh is extremely powerful in providing overall observability across the infrastructure. In this article, we have just offered a small use case of metrics scrapping and visualization using Istio, Prometheus, and Grafana. You can perform logging and tracing of logs and real-time traffic using Istio; we will cover those topics in our subsequent blogs.
If you are a DevOps or an SRE, please check our IMESH youtube channel for the latest videos on Istio and Envoy.