As Kubernetes‘ environments scale, understanding service-to-service communication becomes increasingly complex. When traffic fails or latency spikes, traditional monitoring tools often lack the deep network visibility required to quickly identify root causes.
This is where Network Observability with Hubble becomes essential. Built on Cilium and powered by eBPF, Hubble provides real-time visibility into traffic flows, service dependencies, and security events across your cluster.
In this blog, we’ll explore how to enable and use Hubble for network observability, covering its architecture, installation, service map visualization, and real-time traffic monitoring using the CLI.
Video on Network Observability with Hubble
In case you want to refer to the video, then here it is (disclaimer: I have used AI-voice over to avoid MTI from my accent)
What is Hubble?
Hubble is an open-source network observability platform built on top of Cilium and powered by eBPF (Extended Berkeley Packet Filter). It provides deep visibility into network traffic and security events inside Kubernetes clusters.
Unlike traditional monitoring tools that rely on logs or sidecars, Hubble captures traffic data directly from the Linux kernel using eBPF. This allows it to deliver high-performance, real-time insights into how services communicate across your cluster.
What is Network Observability with Hubble?
Network Observability with Hubble refers to using Hubble to monitor, analyse, and troubleshoot Kubernetes’ network traffic in real time.
In modern microservices architectures, applications constantly communicate across pods, services, and namespaces. When latency spikes or connections fail, identifying the root cause can be challenging.
Hubble enables network observability by:
- Capturing pod-to-pod and service-to-service traffic
- Providing real-time flow monitoring
- Displaying service dependency maps
- Tracking allowed and denied traffic based on policies
- Offering Layer 7 visibility for HTTP, DNS, and gRPC
- Helping detect security violations and dropped packets
Because it operates at the kernel level using eBPF, Hubble provides detailed network insights without impacting application performance.
In simple terms, Network Observability with Hubble gives DevOps and SRE teams complete visibility into Kubernetes networking, making troubleshooting faster, security stronger, and cluster operations more reliable.
Now, let’s move to the Hubble architecture.
Hubble Architecture
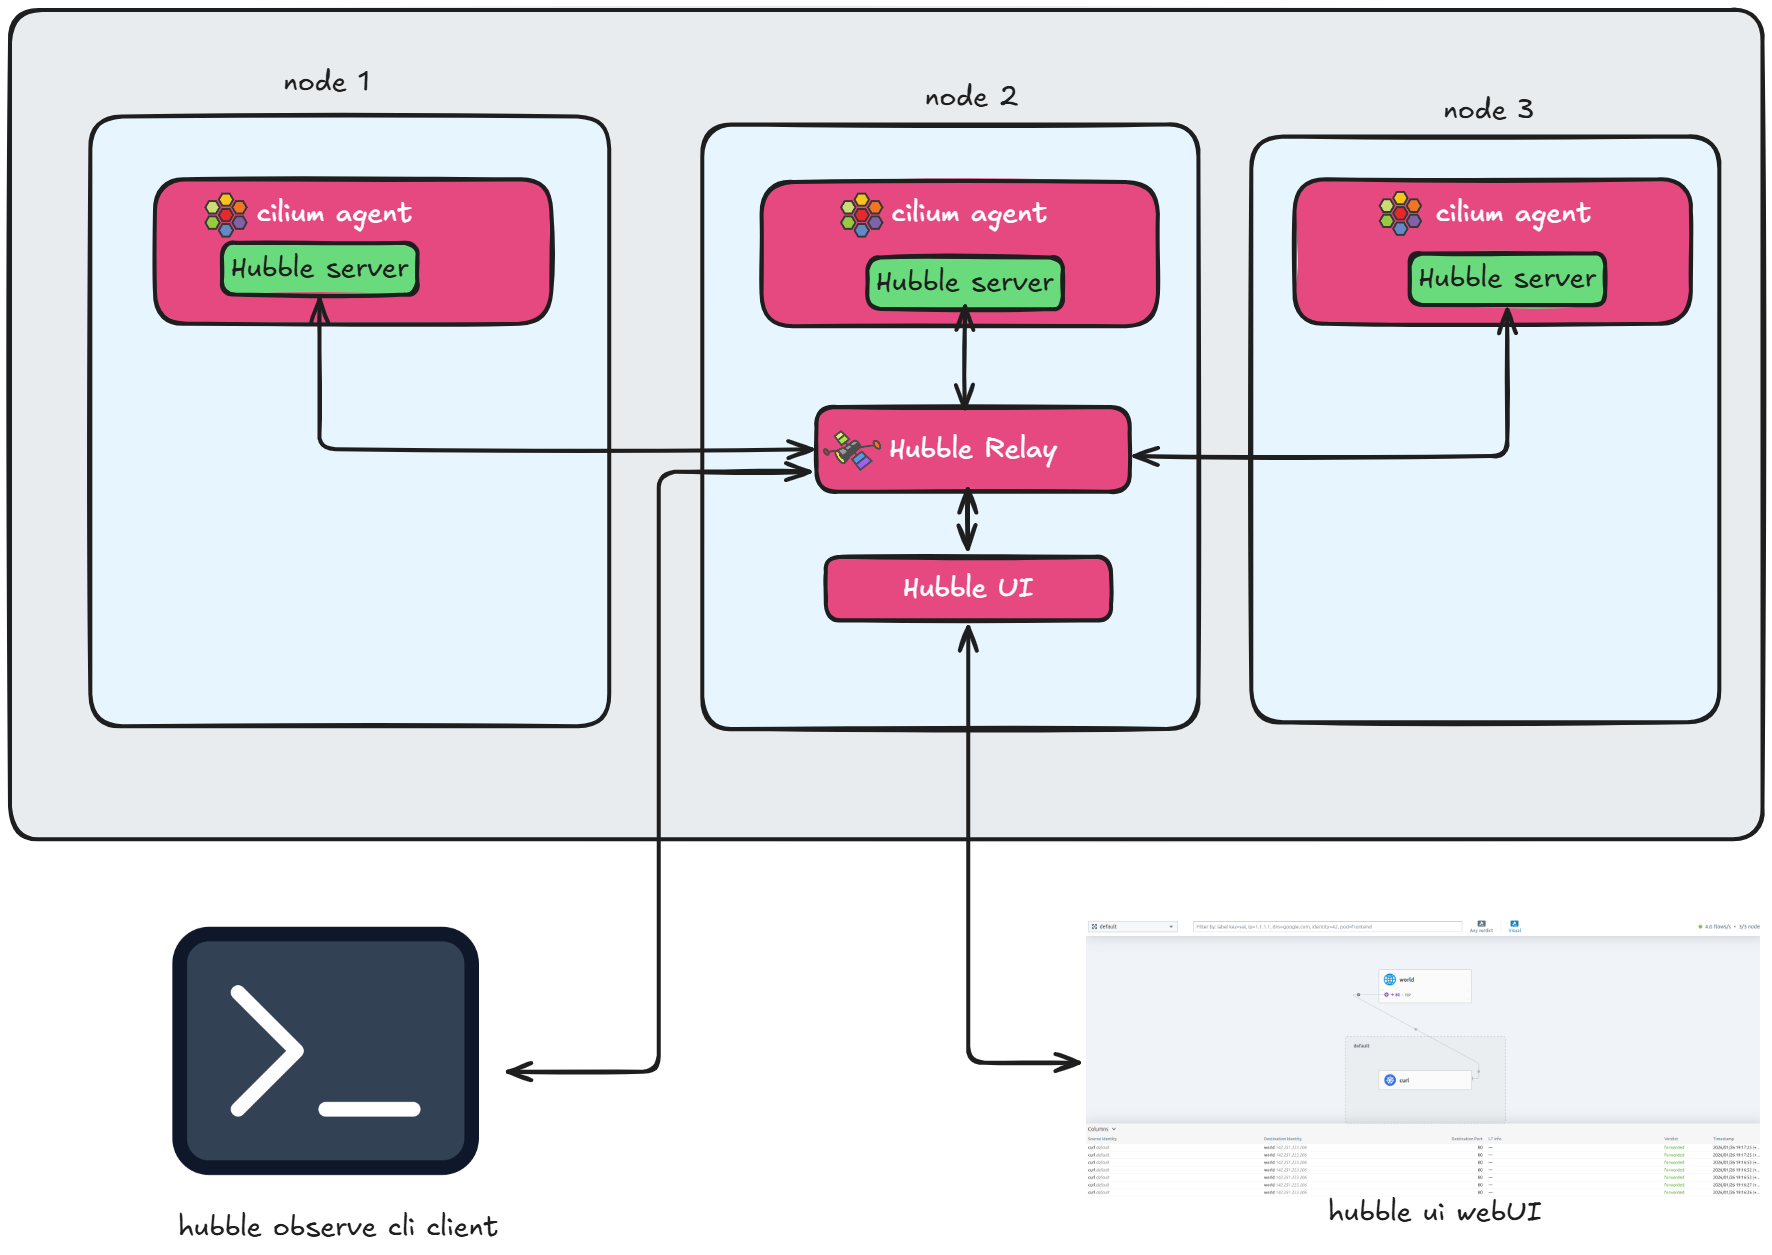
FIG 1: Hubble architecture
Now, let’s understand the Hubble architecture. You can see we have three main components for Hubble:
- The Hubble Server
- The Hubble Relay
- And the Hubble UI
Let’s break down what each one does.
First, we have a Hubble Server. This actually runs inside the Cilium Agent. Since the Cilium Agent is a DaemonSet, the Hubble Server runs on every single node and collects all the flow-related data for that specific node.
But this raises a question: If the data is on each individual node, how do we collect it cluster-wide?
That is where Hubble Relay comes into the picture. Hubble Relay connects to all the Hubble Servers using gRPC on port 4244. It aggregates all that data into a single place.
From there, we have two ways to consume this data:
- First is the Hubble CLI, which connects to the Relay to show us the text-based traffic flows.
- Second is the Hubble UI. We expose this as a service, which we can use to visualize the Service Map and check traffic verdicts directly in the browser.
One thing to notice here is that the Relay itself listens on port 4245.
Now that we have covered architecture, let’s see what flags we need to configure Hubble and the Hubble UI.
Installing Hubble Relay and UI
We are adding two specific flags:
- The first flag is to enable Hubble Relay. This ensures that we can aggregate data from all nodes.
- The second flag is to enable the Hubble UI, so we can visualize that data.
So, these are the two main additions we need to make to our Helm command.
Enabling Hubble in Cilium is straightforward using Helm.
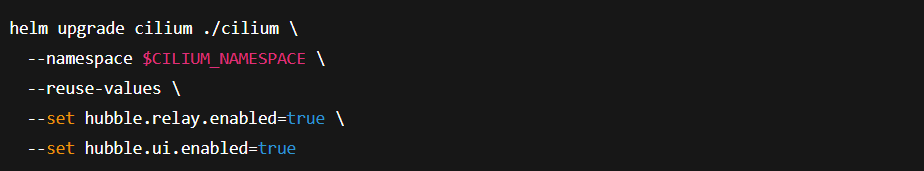 What this Command does
- Enables Hubble Relay
- Reuses existing Cilium configuration
- Enables Hubble UI dashboard
After installation
- Verify pods are running
- Access the Hubble UI dashboard
- Start visualizing traffic flows
Exploring the Hubble Service Map
One of the most powerful features of Hubble UI is the Service Map.
What the Service Map Shows
- Service-to-service communication
- Incoming and outgoing traffic
- Namespace-level visibility
- Traffic direction
- Allowed vs denied flows
This gives teams
- Immediate understanding of microservice dependencies
- Faster troubleshooting
- Better security posture validation
Instead of digging through logs, you visually identify communication paths.
Using Hubble CLI to Monitor Real-Time Traffic Flow
Finally, we’ll use the Hubble command line utility to check real-time traffic flow inside the Kubernetes cluster.
The Hubble CLI allows you to stream live network events directly from your cluster, giving you instant visibility into how services are communicating. Instead of relying only on dashboards, you can observe traffic as it happens.
With the Hubble CLI, you can
- Monitor real-time pod-to-pod communication
- Filter traffic by namespace, pod, or service
- View HTTP requests and response status codes
- Detect dropped or denied traffic
- Analyses DNS queries and Layer 7 traffic
This real-time flow visibility makes troubleshooting faster and more precise. Whether you’re debugging connectivity issues or validating network policies, the Hubble CLI provides deep, actionable insights directly from the terminal.
Final Thoughts
Network visibility is critical in modern Kubernetes environments, where microservices constantly exchange traffic across the cluster.
By enabling Network Observability with Hubble, teams gain real-time insights into traffic flows, service dependencies, and security events. From understanding Hubble architecture to visualizing the Service Map and using the Hubble command line utility to check real-time traffic flow, you now have a complete approach to monitoring Kubernetes networking.
For organizations running Cilium in production, Hubble is not just an observability tool, it’s an essential component for secure, scalable, and reliable Kubernetes operations.
If you’re planning to adopt Cilium in production or need expert guidance, reach out to our Cilium experts.